Period Targets

We are pleased to announce the latest enhancement to the Analysis-One Toolkit: Period Targets for the financial scorecard and KPI scorecard. In the past targets were set for these scorecards on a global basis. This meant that when the targets where set or changed they applied to all periods in the model. This was useful to compare relative changes in performance from one period to another but users have indicated that in many circumstances it is appropriate to vary the targets from period to period, thus catering for variations such as seasonality or the measurement of incremental improvement.


To use period targets, open the scorecard tool and click on the “Set unique targets for each period” button which appears at the bottom of the target screen.


This activates an “edit targets” button.


Click on the “edit targets” button to set unique targets for any period in the model.


A further minor change has been made regarding the recording of comments on period results for both scorecards. Comments are now entered on the target screen and not on the scorecard screen. Click on the notepad icon, to the right of the measure, to create a comment.


New Feature: Horizontal Analysis
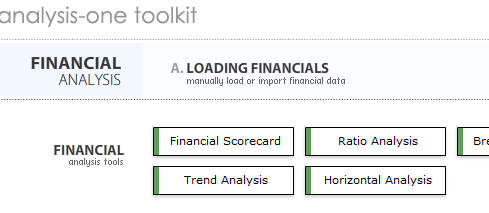
We’d like to announce the latest addition to the analysis-one toolkit - 'Horizontal Analysis'.

The 'Horizontal Analysis' tool gives insight into the change between two financial periods for every item in the income statement, balance sheet and financial ratios.

We don't stop there though! Visual cues highlight the positive and negative effects of each item with respect to overall business value. Problem areas are quickly identified. The report is also available for download in Word and Excel allowing you to include the data in your own reports.

The first step is to login and go into your model/business. Then choose the new 'Horizontal Analysis' button.

 
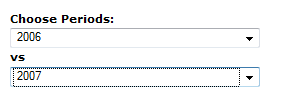
Next, choose two periods to compare.

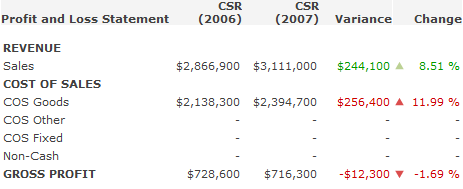
The result is a powerful visual analysis that shows the dollar change and the relative percentage change for each item in the Income Statement and Balance Sheet. Positive effects are highlighted in green, negative effects are highlighted in red. Arrows are used to show the direction of the change. 


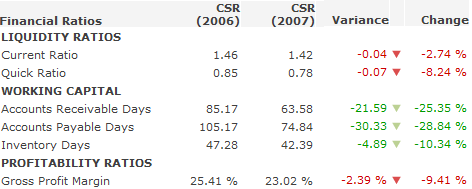
You will also see the Financial Ratios...


And finally, at the bottom of the page you have the ability to export the results to Word or Excel.

That’s it! We hope you enjoy the new tool. Please contact us if you have any feedback.    
Introducing the new analysis-one website!
The team at eis-one is pleased to announce the launch of the new analysis-one website. This website seeks to demonstrate the features and functionality of the analysis-one tool. Included in this website are video tours, sample screenshots and also the ability to request a trial evaluation of the tool. We hope that the contents of this site will demonstrate the use of analysis-one as an online tool for business performance management.

In addition, the website also has a supporting blog which will act as a forum to announce new enhancements and features. We anticipate that planned features currently in the development 'pipeline', may also be announced via this blog.

Postings related to the subject of business performance analysis will also appear in this blog.
Free 14 day trial

Try it for free! Sign-up now for a 14 day trial.