Introducing Open Measures – the smart way to benchmark performance
 

The developers of Analysis-One are pleased to announce the launch of a new application – Open Measures.
 
Open Measures is an online tool which gives business decision-makers the ability to easily assess the performance of multiple entities – such as a business divisions, branches, franchises, schools or individuals – relative to their peers over time. It provides a meaningful framework to measure performance in reference to peers and targets. Because expectations constantly change – and what was rated as good performance in the past may not be as impressive today – Open Measures allows for regular and timely repeat assessments.

Open Measures is designed to support mid‐market enterprises which are keen to keep a close watch on how their operations are performing.  This new application is a secure turn‐key offering deployed via the web as a ‘Software as a Service’ solution. It is simple, cost effective and data rich.


Sue‐Ella Prodonovich, Principal, Business Development Services, WHK Horwath Sydney, said the new software will allow everyone from CEOs and COOs to operational managers to better manage their businesses. “This product is perfect for companies with multiple operating parts – for example a franchise network, a firm with regional or State‐based branches or simply an organisation with a number of different divisions.”

“Management can use this software to track KPIs, compare targets, monitor trends and even identify high and low performing staff. ‘Open Measures’ really is an ‘operating dashboard’ for companies.”

“We believe ‘Open Measures’ is the best product of its type available on the market,” added Prodonovich. “Companies can now rank their performance via easy‐to‐view charts that will provide visual interpretation of how the business is tracking in comparison to peers. This will allow management to identify opportunities and risks more readily – and then refine strategy if need be to address any problems.”

For more information please visit www.openmeasures.com  or contact us.
Period Targets

We are pleased to announce the latest enhancement to the Analysis-One Toolkit: Period Targets for the financial scorecard and KPI scorecard. In the past targets were set for these scorecards on a global basis. This meant that when the targets where set or changed they applied to all periods in the model. This was useful to compare relative changes in performance from one period to another but users have indicated that in many circumstances it is appropriate to vary the targets from period to period, thus catering for variations such as seasonality or the measurement of incremental improvement.


To use period targets, open the scorecard tool and click on the “Set unique targets for each period” button which appears at the bottom of the target screen.


This activates an “edit targets” button.


Click on the “edit targets” button to set unique targets for any period in the model.


A further minor change has been made regarding the recording of comments on period results for both scorecards. Comments are now entered on the target screen and not on the scorecard screen. Click on the notepad icon, to the right of the measure, to create a comment.


Modelling the impacts of the Financial Crisis
In the current economic climate, businesses are likely to encounter conditions which will threaten the health and viability of operations. Exposure to such conditions will probably cause a decrease in the demand for products and services and cause an increase in operating costs. As a response, decision makers could place a renewed emphasis on lean management principles and undertake cost cutting measures (ie. seeking staff redundancies) . To further protect the bottom line, decision makers may also seek to extend supply terms (creditor days) in anticipation of higher inventory days and slower collection of receivables.

In this example, the impact of the current economic climate is modelled using Analysis-One (www.analysis-one.com). Using the Analysis-One forecast tool, we are able to model the likely impacts of changes to key business drivers and generate a view of forecast financial performance.

We will assume the following adverse impacts will affect performance:

Adverse Factors
Prices will be forced down -4 %
Volumes of sales will decrease -6 %
Cost of Sales will increase +3 %
Debtors will pay slower +15 Days
Inventory will be held longer +20 Days


We can also assume that management will undertake the following mitigating steps in response:

Mitigating Factors
Creditors will be paid later +10 days
Staff will be retrenched -10 %
Overheads will be cut -5 %
Funding costs will decrease -4 %

Screenshot : analysis-one forecasting tool


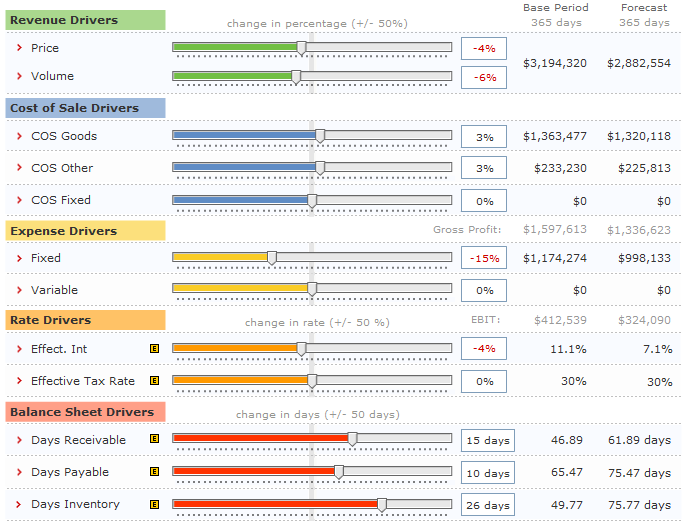
Using the Analysis-One forecast tool (see screenshot), we are able to model the impact of these assumptions on key performance indicators (see table below).


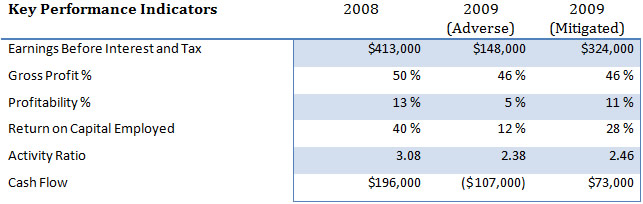
In this example, we clearly see the impact of the adverse factors on performance, while also considering the potential effect of efforts undertaken to mitigate these adverse factors.

Modelling allows management to plan for reduced demand and rising costs and to predict the impact on profitability and cash flow. Importantly in this modelling scenario we are measuring the impact on Key Performance Indicators (KPIs) such as EBIT, Gross Profit %, Profitability % (income statement), while also considering the impact on cash flow and funding (balance sheet).

Accurate and timely modelling is a powerful tool for decision makers and businesses in the current economic climate.
Mashable includes Analysis-One in list of “Tools for Running a Business Online”

Analysis-One is honoured to be included in Mashable’s comprehensive list of essential tools for running a business online.


Mashable is one of the world’s largest technology blogs for Web 2.0 related news. Analysis-One is featured in the “Organization & Management” category of this list.


For interest, here are some online tools which we use on a daily basis to run our business:


1. For online demonstrations we use GoToMeeting
2. For website analytics we use Google Analytics
3. For uptime monitoring we use Pingdom
4. To manage our sales pipeline we use Salesforce
5. For bug tracking we utilise Mantis
6. For email and promotional campaigns we use Campaign Monitor
7. To gather feedback we use SurveyMethods
8. For staff professional development we use the training libarary at Lynda.com
9. And of course, we use Analysis-One to measure and monitor the financial and non-financial performance of our business.

We would happily recommend these tools to other businesses.

New Feature: Horizontal Analysis
We’d like to announce the latest addition to the analysis-one toolkit - 'Horizontal Analysis'.

The 'Horizontal Analysis' tool gives insight into the change between two financial periods for every item in the income statement, balance sheet and financial ratios.

We don't stop there though! Visual cues highlight the positive and negative effects of each item with respect to overall business value. Problem areas are quickly identified. The report is also available for download in Word and Excel allowing you to include the data in your own reports.

The first step is to login and go into your model/business. Then choose the new 'Horizontal Analysis' button.

 
Next, choose two periods to compare.

The result is a powerful visual analysis that shows the dollar change and the relative percentage change for each item in the Income Statement and Balance Sheet. Positive effects are highlighted in green, negative effects are highlighted in red. Arrows are used to show the direction of the change. 


You will also see the Financial Ratios...


And finally, at the bottom of the page you have the ability to export the results to Word or Excel.

That’s it! We hope you enjoy the new tool. Please contact us if you have any feedback.    
Free 14 day trial

Try it for free! Sign-up now for a 14 day trial.